The Future of Plant Health Care Is Presence and Property Data
One season into running Upper Arlington Tree Co., I pulled the numbers out of my own software. Twenty properties. 196 trees, each with its own chart. Just over 3,000 data points — every one dated, and every one anchored to a specific tree at a specific address. That's what one arborist, one neighborhood, and one growing season produce when the record is the point. It changed how I think about where this discipline is going.
What one season of showing up looks like.
These aren't projections and they aren't a demo. Here's the shape of one season on my own book — every kind of data, all of it anchored to the same properties, layer on layer:
One season · one book · data in the context of a property
- The parcel — species, size, every pin
- Photos, tied to the tree
- Assessments & steward visits
- Soil & tissue lab panels
- Care recommendations
- Work orders & treatments
- Health events & watching flags
Every layer, one address — just over 3,000 dated points across them in a single season, twenty properties. The needle is the AI: it reads the whole stack, in the context of the place.
A "data point" here means something specific: a dated observation attached to one tree at one address. A leaf photo with the chlorosis getting worse. A soil panel from a university lab with the pH sitting at 7.8. A structured assessment of a silver maple's deadwood. A care recommendation that hasn't been sold yet. A message in a diagnostic thread where the AI and I worked a differential against that tree's own history.
About that purple line — I'll be straight. Plenty of my AI casework is me studying for my ISA certification against my own book, asking the questions an apprentice asks a mentor. I count it as part of the record anyway, because every message is scoped to a real tree on a real chart, and what comes out of it — the differential, the citation, the flagged problem — lands on the record, not in a tab I'll never find again.
None of it is exhaust. All of it compounds.
How I used to do this.
I've lived the old way, professionally and full-time. At our family's heritage apple orchard in Pennsylvania, we tracked a hundred-plus trees the way most of this industry still does: aluminum-stamped tree tags that fell off, got chewed off, or disappeared into the grass and the snow. A spreadsheet that was difficult on a good day and impossible by August. Flagging tape for the borers and the rust — when we had tape on our person. We cared about those trees as much as anyone can care about trees, and the system still leaked everywhere.
The modern version of that kit is a spreadsheet, a ChatGPT tab, an iMessage thread, and the camera roll. The diagnostic wave in tree care is real — TCI Magazine, the trade body's own publication, named it this spring: the shift to diagnostic PHC. And the practitioners leading it are running their assessments through single-thread AI chats and filing the results in the same places my orchard tags went.
Each of those tools is genuinely good at the moment of capture. That's exactly the problem. The data dies where it lands:
- The spreadsheet doesn't know the tree. Row 340 says "maple — treated." Which maple? Which symptom? What did it look like the season before?
- The ChatGPT tab gives you a sharp answer and forgets the property the moment you close it. Next season you're re-explaining the same tree to a blank box.
- The iMessage thread holds the client's photo of the yellowing leaves — two hundred messages up, between a scheduling change and a thumbs-up.
- The camera roll has the timestamp and the GPS and no tree. Four hundred photos deep, nobody can say which crown belongs to which chart — because there is no chart.
Every one of those tools loses the thing plant health care actually runs on: the tree's history, in sequence, in one place, readable the next time you stand in front of it.
Presence is the input.
The number in that chart that matters most isn't the total — it's the cadence underneath it. This spring I started the Tree Steward program: four visits a year, every visit logged. I'm one round in, with half a dozen clients — and one round was enough to see the shape of it. I walk the same properties. I pull soil cores on visits I'm already making — sometimes while a removal crew I've referred in works overhead. I photograph in July the same leaves I photographed in April.
You cannot diagnose a tree you visit once. A tree is a sixty-year patient with a two-season memory problem — the stress it took last summer shows up as the limb that fails next March. The only way to see that is to be there on both ends of it, with the record in between. Presence generates the observations. No amount of software generates them from an armchair.
Presence generates the data. The data makes the next visit smarter. That loop — not any one feature — is the practice.
And presence pays in a currency the removal business never sees: trust. When you show up as the person keeping the trees rather than the person selling their removal, homeowners hand you the whole property. The big removals that don't fit that vision, I refer out. What stays is the relationship — and half a dozen steward clients, one round in, already lead my book on lifetime value. The relationship is what keeps filling the chart.
The canvas nobody can see.
Property data isn't data in thin air. It's observations pinned to a canvas — and that canvas is invisible to almost every stakeholder who needs it. The homeowner sees their own yard. The city sees its street trees, on a good year. Nobody sees across the property lines, and the properties themselves trade hands too often for anyone to keep track of what's happening on them.
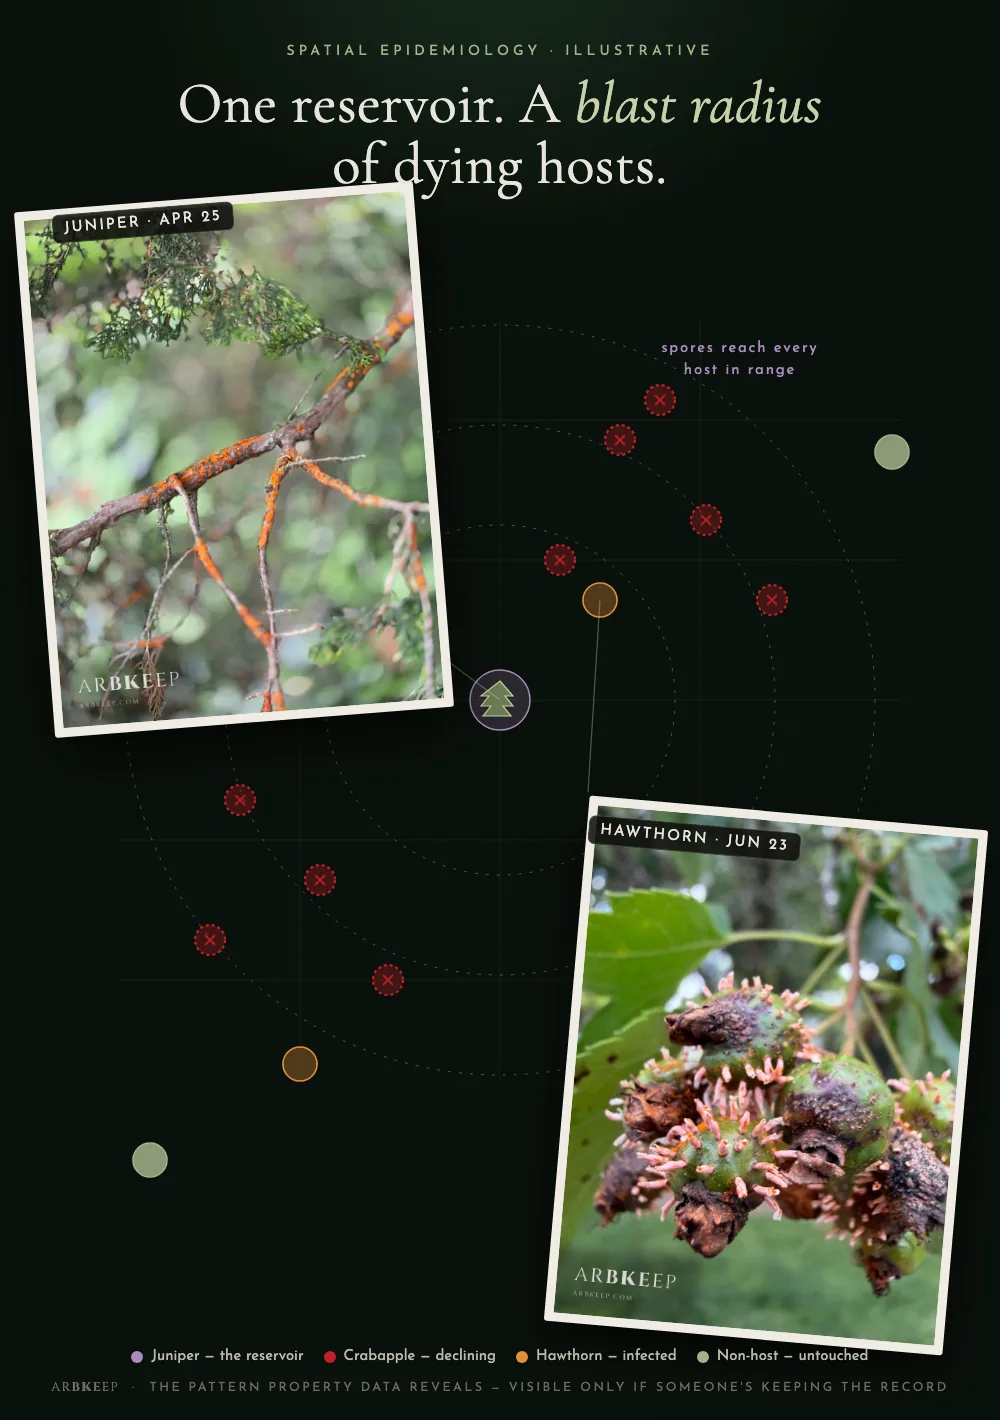
Here's what the canvas showed me this season. I flagged quince rust on a client's junipers — a routine finding, one property. Then the record started connecting it: nearly every dead and dying crabapple in a blast radius around that property — street trees and private trees alike — plus the hawthorns and the serviceberries, all hosts on the other half of that fungus's life cycle. No single stakeholder could have seen that cluster. The homeowner sees one sick juniper. The city sees one dead street tree. The map sees an outbreak with a radius.
I've mapped my way to an invisible pattern before, in a harder field. The Recovery Deserts project I co-authored with Ohio State researchers worked for exactly one reason: the team pulled in every possible data point tied to the location of an overdose, then mapped the gaps in the treatment and recovery ecosystem around it. Data, in the context of a place. The pattern nobody could see became undeniable — it made a peer-reviewed journal and it changed how a county talked about access. Trees are easier patients. They don't move.
Property data is the output.
The other half of the thesis is where the data lives. Every one of those 3,005 points is anchored to a property — not to my phone, not to a job number, not to a conversation. That one design decision is what makes the data compound instead of evaporate:
- Retest the soil next spring and the number lands beside last year's. The trend tells the story no single test can.
- The differential gets sharper. When the AI works a case on that pin oak, it isn't reasoning from a generic model — it has the soil panel, four seasons of leaf photos, and every prior finding on that exact tree.
- The record outlives the owner. When the property sells, the trees don't reset to zero. The next owner inherits the chart with the deed — the way a house's title history follows the house.
This is the part the field is circling but hasn't landed. The breakthrough isn't AI in tree care — arborists are already pasting assessments into single-thread chats; I hear about it every week. The breakthrough is an AI that has been fed every single data point scoped to the property: the soil chemistry, a season of photos, the lab results, the dying crabapples down the street. That's not a better chatbot. It's the same shape medicine is using against cancer — not one consult, but the entire longitudinal record, reasoned over at once.
Data in the context of a property. That's the game-changer.
And the record has started paying my clients back in ways I didn't design up front — a seasonal care calendar built from their own trees' needs instead of a generic checklist, growth curves that estimate a tree's age and project a decade ahead, watering guidance that knows what the weather did this week, and the newest research from the land-grant extensions I trust most, pulled in the moment it publishes. I'll write about those separately. The point here is simpler: none of it is possible without the substrate.
Year five of a record like this is worth ten times year one. That's not a growth projection; it's just what longitudinal data does. It's also why none of the tools in the list above can get there from here — a spreadsheet doesn't compound, and a chat tab doesn't transfer with a deed.
Show up. Pay attention. Document everything.
That's been my through-line for twenty years of work that had nothing to do with trees, and it turns out to be the whole thesis, in order. Show up — presence. Pay attention — diagnosis. Document everything — property data.
The future of plant health care is arborist presence and property data. Not as a pronouncement — nobody in this discipline has all the answers, and even the universities run out of step with their own research sometimes. This is a practice: it takes as much tool sharpening and sterilization as it does research and review, and the record is how a practice learns. The discipline has already turned diagnostic. What hasn't caught up is where the diagnosis lives — and spreadsheets, ChatGPT, iMessage, and the camera roll aren't going to cut it. Not because they're bad tools. Because not one of them knows the tree.
If you're an arborist building a book like this — the recurring visits, the soil cores, the photos you keep meaning to organize — ArbKeep is the chart I built for my own practice: one record per tree, anchored to the property, for its whole life. If you run your own book and want to help shape the tool, Heartwood is the small guild building it from inside the work.
And if you're a homeowner wondering about the maple you can see from your kitchen window — point your phone at it on arbkeep.com. It's free, no account. That photo becomes the first data point on your tree's chart. Season two is when it starts getting interesting.
David All · Arborist in Upper Arlington, Ohio — by way of heritage apple orchards in Pennsylvania and old-growth conifers on the Olympic Peninsula. Builder of ArbKeep — the health record for trees. Featured in The Guardian. Ohio Chapter ISA member · Upper Arlington Tree Co.